Northwest Hydro Flexes it's Polar-Vortex Muscle and 'Gone Went the Wind'
The question isn't, can you integrate tens-of-thousands of average megawatts of unreliable wind farms into the grid? The question is, should you?
“Extreme heat” has been in the news a lot lately. But did you know on a worldwide basis more people die from cold than heat . . . and it's not even close.
In the United States we take it for granted that we have protection from nature during severe cold, but that is not the case in countries without access to affordable and reliable electricity.
I thought about this every time I went outside during the polar-vortex deep freeze we just lived through and imagined what it would be like not to have electricity or natural gas to heat my home, and have a warm and safe place to retreat.
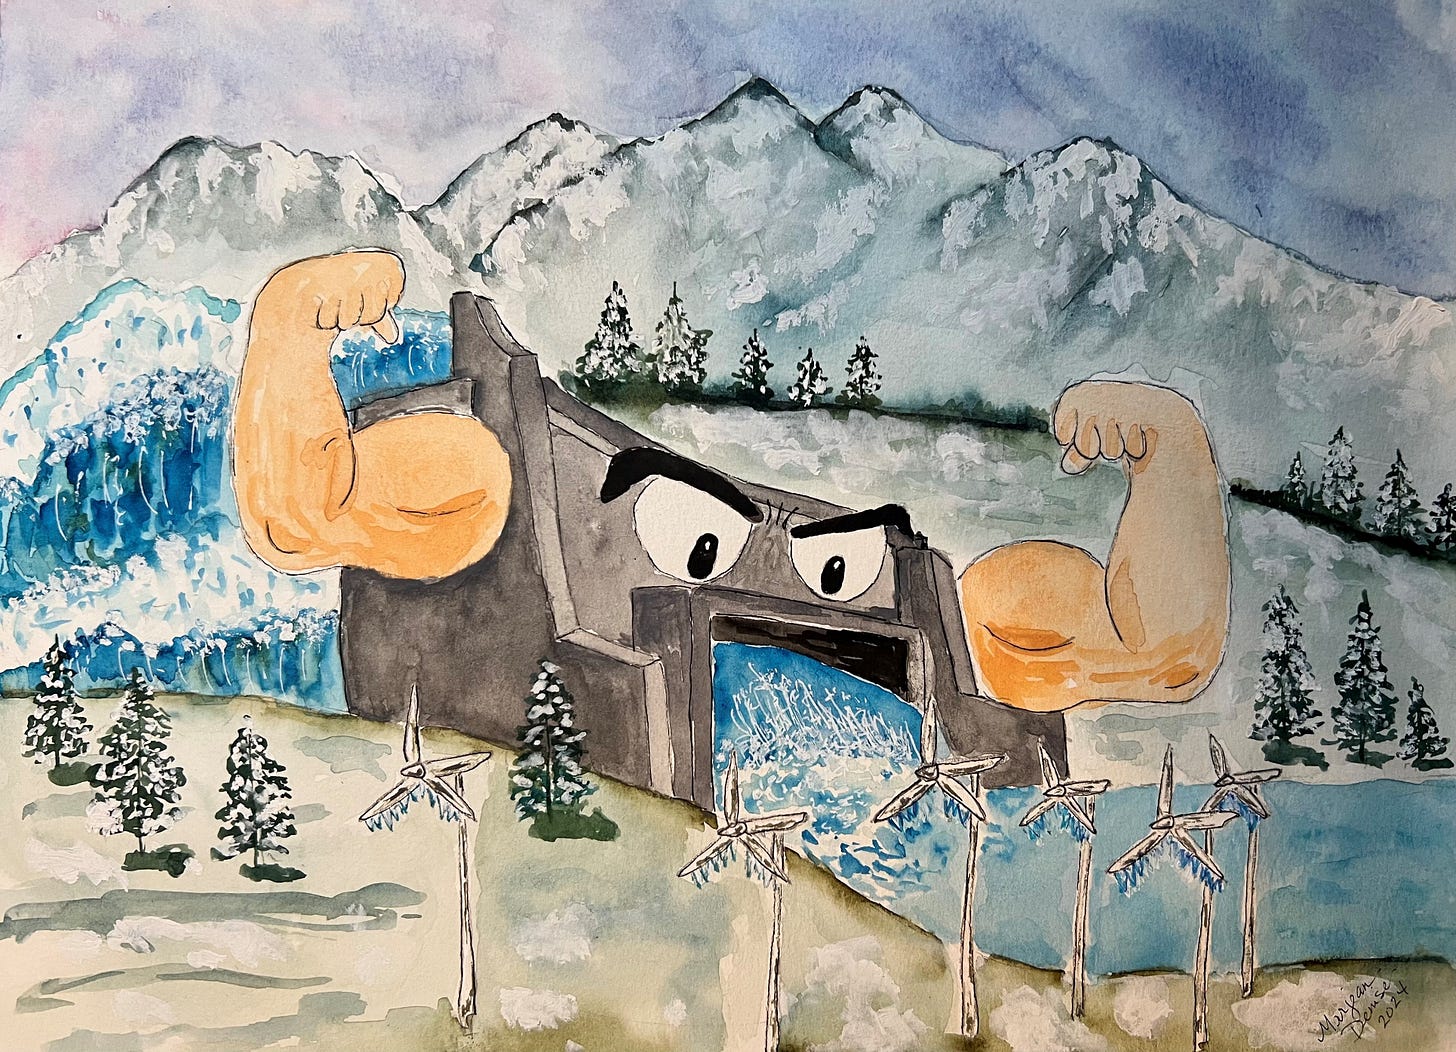
If like me, you and your family were warm and safe as temperatures plunged into the single digits, you can thank Northwest hydropower. And of course, I couldn’t help but recruit my wife for another piece of art inspired by what became the title of this post.
As it turns out the timing of the polar vortex couldn’t have been better for reinforcing the central message of what I wrote about in a previous post which featured a detailed review of how critical hydropower is to Northwest power grid reliability. https://rickdunn.substack.com/p/sawing-off-the-branch-were-sitting
What I have to say about Northwest hydro is not new, as there has been no shortage of information over the past week regarding how it once again saved the day. My take on wind power is also part of the common theme, but with a much bigger picture in mind.
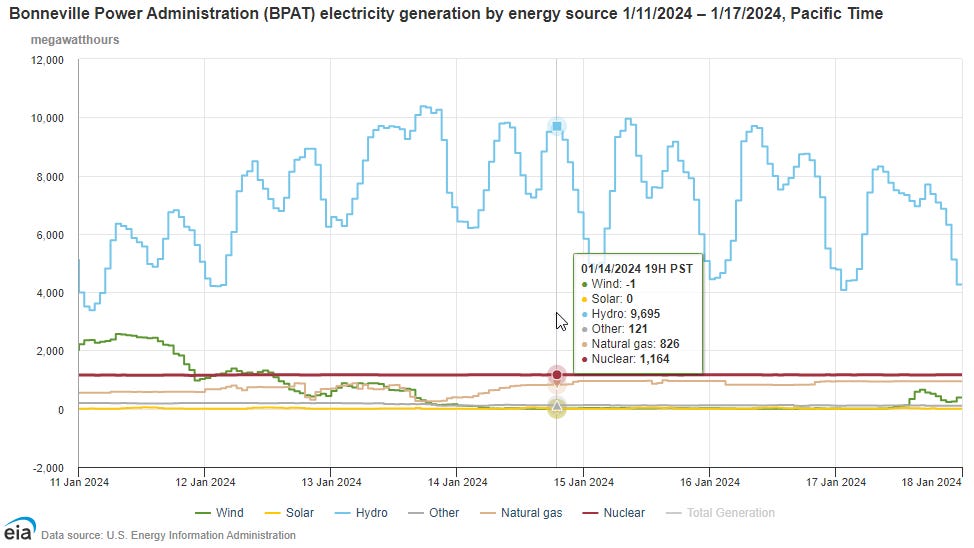
But just in case you missed it, check out the following graph which shows how power generation resources in the Bonneville Power Administration’s balancing area footprint (BPAT) performed as temperatures plummeted into the single digits across the Northwest.

It’s no surprise that ramping up federal hydro is BPAT’s answer to maintaining demand and supply balance, cranking out more than 10,000 average megawatts (MWa) during the highest demand hours. You will notice natural gas had some fuel supply issues during the week so generation dropped at an inopportune time, but then recovered.
While I am a big fan of natural gas for it’s high energy-density and small physical footprint, the just-in-time fuel delivery that depends on the continuity of pipelines, storage facilities and compressors is a significant potential liability.
This is also one of the big reasons I believe nuclear power with on-board fuel is a superior generating technology; particularly if your goal is a reliable and resilient grid. My belief was confirmed by the always-on Columbia Generating Station nuclear plant which provided 1,164 MWa and performed flawlessly throughout the deep freeze.
As for wind, the 2,827 megawatts (MW) of nameplate generating capacity inside the BPAT footprint was generating over 2,000 MWa during some hours before the coldest polar air arrived, but eventually bottomed out and made almost zero contribution to grid reliability. And if that wasn’t bad enough, during several hours, BPAT wind farms were actually drawing power from the grid which is represented by the net -1 MWa shown on the graphs for hour ending at 7 pm on January 14th.
To be fair, sizeable Oregon and Washington wind farms exist in other balancing area (BA) footprints adjacent to BPAT, including Avangrid Renewables, LLC (AVRN) and Washington-based investor-owned utility Puget Sound Energy (PSE).
An interesting back story. AVRN is a generation only BA with both wind and natural gas resources. AVRN wind farms were originally part of the BPAT footprint, but Avangrid believed the rates the Bonneville Power Administration was charging them for balancing services were too high. So, Avangrid formed their own balancing area authority (BAA) and moved their Northwest wind assets out of the BPAT footprint.
My understanding is the natural gas in the AVRN footprint is Avangrid’s Klamath Energy Facility, a 591-MW combined-cycle natural gas facility with a steam turbine and peaking natural gas facility owned by an Avangrid affiliate.
The AVRN balancing area reminds me of a quote I heard some years ago . . . “natural-gas is wind power’s best friend”. And you have to admit, there is irony in the fact a company with “Renewables” in their name is depending on ‘evil’ natural gas to optimize the value of their wind farms.
Just like what happened inside the BPAT footprint, you can see in the following graphs, AVRN wind generation which is mostly located south of the Columbia Gorge in Oregon started fairly strong just before the polar air arrived; but then steadily decreased until bottoming out and becoming additional electricity demand on the grid; registering -16 MWa during the hour ending 8 am on January 14th.
As for PSE, the story was no different both for wind and natural gas with the latter working together with hydro to keep the lights on across the Pacific Northwest during the hours and days of coldest temperatures. It should be noted, PSE also has a bit of hydro in their footprint which you can see was bumped up in generation level during the coldest days between January 12th through the 15th.
The fact Washington and Northern Oregon wind farms were AWOL (absent without leave) during the coldest days of the polar-vortex event is not a surprise to utility planners.
In the case of Washington, I wrote a previous Substack post about how analysis performed by the Western Resource Adequacy Program (WRAP) indicates wind inside Washington borders is uniquely deficient in terms of providing “effective capacity” during winter months. https://rickdunn.substack.com/p/washington-wind-farms-are-uniquely
And maybe surprisingly to some, even Washington state energy officials know wind farms in our state cannot deliver on reliability, which they confirmed in a Department of Commerce (DOC) report to legislators in January 2023. In their report to the Washington State Senate, DOC staff shared the state’s clean energy vision which is heavily dependent on out-of-state generating plants; with 43% of electricity expected to be imported into the state by 2050. And of that amount, 36% of the imports would come from wind farms in Montana and Wyoming.
And of the 63,000 MW of onshore wind envisioned for the Northwest (more than one-hundred Seattle-sized wind farms), Washington is only expected to host 2,000 MW or 3% of the total.
WHAT ABOUT WIND POWER WHERE THE WIND REALLY BLOWS?
But enough about the deficiency of Washington and Oregon wind. What we are hearing from policy makers and utilities in both states, and across the entire west, is we must rapidly build numerous high-voltage transmission lines to the east, so we can tap into much better wind resources. These locations (states) are dramatically represented by the land area corresponding to the orange and purple color tones in the following map.
As the map shows, there is no doubt eastern Montana and Wyoming represent some of the premium western locations for wind farms. But there is nothing like the states right down the middle of the country.
So lets take a look at how wind farms located east of the northwest, and those in the central U.S. performed during the polar-vortex deep freeze; starting with the area inside the gray boundary line of the following grid balancing area map.
Like Washington and Oregon wind farms, those located further to the east also started fairly strong with more than 12,000 average megawatts (MWa) of combined generation inside the greater Northwest (NW) footprint just before the polar air started plunging to the south on January 12th. But as the hours and days progressed, the wind generation across the entire region dropped to a combined low of 784 MWa on Janaury 14th.
So yes, you can generate a lot of average energy from wind by aggregating farms across a large geographical footprint. But an uncontrollable drop in generation of more than 11,000 MWa during dangerously cold temperatures is not a minor deficiency when it comes to ensuring power grid reliability.
Wind Farms in the Central United States
Now lets go big and see how the premier wind farms in the central U.S. faired. The first thing you should know is, unlike the west with 38 individual balancing area authorities, much of the central corridor of U.S. states depend on a single entity called the Southwest Power Pool (SWPP) to perform power grid demand and supply balancing.

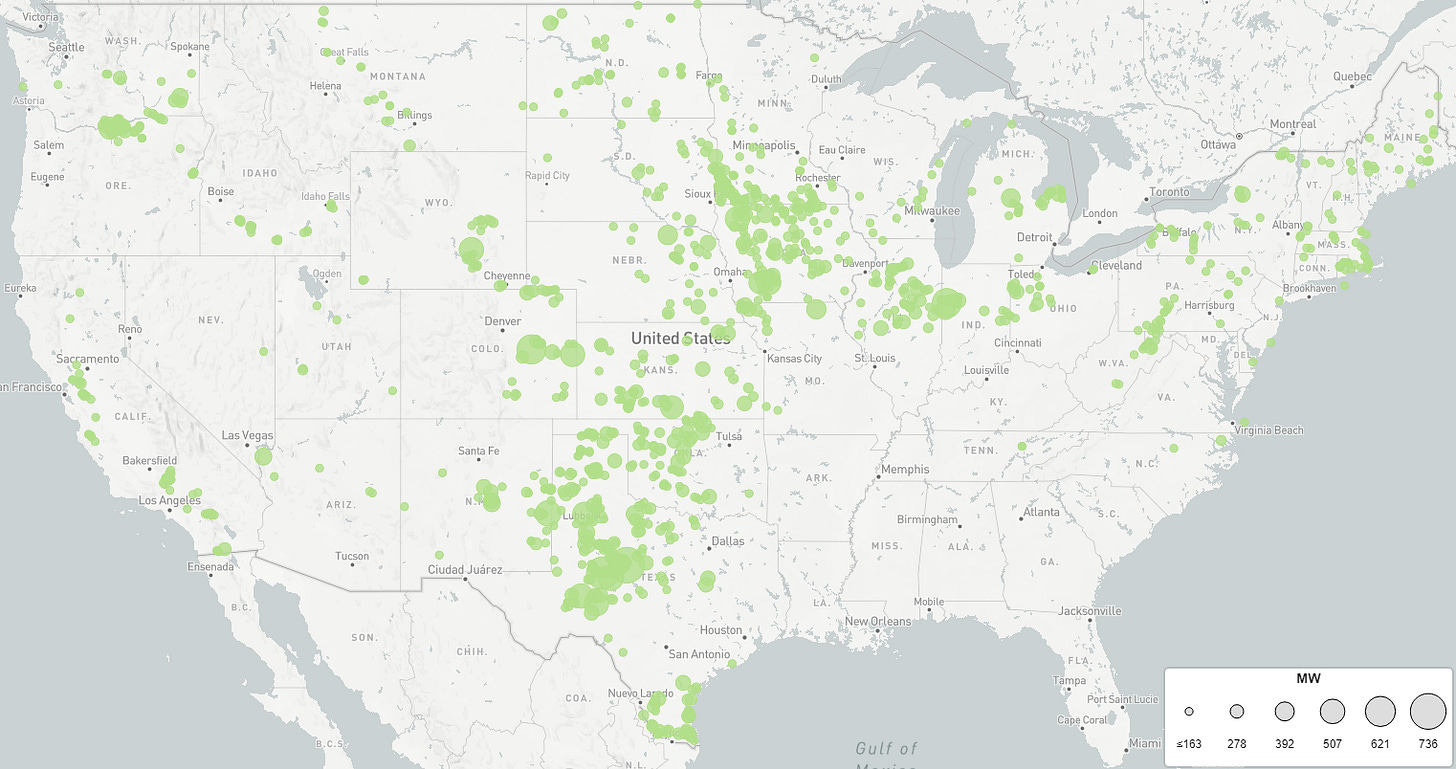
As we consider the SWPP footprint, which includes states from as far north as North Dakota to as far south as Texas, it is also helpful to look at the following map which shows by circle size the installed nameplate capacity of all U.S. wind farms; and illustrates how much bigger a deal wind is in the center of the country compared to anywhere else.
According to the U.S. Wind Turbine Database there are currently 73,352 individual turbines with 144,950 MW of total generating capacity installed across the country.
And according to SWPP, the nameplate capacity of wind installed inside their footprint is 31,217 MW. While that is an impressive total, the Electric Reliability Council of Texas identified as ERCO in the previous balancing area map has 37,725 MW of installed wind capacity inside it’s footprint, which only includes Texas. So combined, SWPP and ERCO account for more than 47% of U.S. wind farm generating capacity.
As a side note, scroll back to the previous map and consider the nearly 69,000 MW of combined wind farm capacity already developed in the middle of the country, and then imagine what 63,000 MW of wind farms envisioned by Washington’s state energy strategy would look like, and the ecological impact it would have on the greater northwest.
So how much of the SWPP wind capacity showed up during the dangerously cold temperatures which were in minus double digit territory across most of their footprint. The following graph shows the corresponding increase in electricity demand as polar air moved south. As the curve shows, SWPP reached its maximum demand of 51,017 MWa during the hour ending at 7 pm on January 14th.
Looking at the generation curves in the next set of graphs, you can see just before the cold temperatures really set in, the SWPP wind generation was supplying impressive amounts of electricity, reaching levels over 20,000 MW and supplying more than half of the total demand in the SWPP footprint. Of course, this is still only 64% of the installed nameplate capacity but impressive nonetheless. What’s more, the average energy being provided by wind was double that of coal and four times as much as natural gas.
But once again, what is concerning is that as the coldest temperatures set in, as little as 4,708 MW of wind generation representing only 15% of the total installed capacity in SWPP’s footprint showed up when most needed.
And for further perspective, the more than 15,000 MW uncontrollable drop in wind generating capacity is like shutting down the equivalent nameplate capacity of 15 Columbia Generating Station nuclear plants, just when you need dependable generation the most. Not surprisingly, what stepped up to keep the lights on was nearly 30,000 MW of controllable natural-gas and coal, with always-on nuclear at a steady 2,038 MW.
There is a very important point that can be learned by pausing and thinking more deeply about what happened in the SWPP footprint on January 14th. What SWPP is managing is essentially two grids; the “clean grid” and the “reliable grid”.
And here’s the key point. Even if the fuel for the wind-based “clean grid” is free, the up-front capital costs of wind farms are significant, with wind power being even more expensive than natural gas in most cases. So, even if a natural gas or coal plant runs less and less over time as their average energy production is displaced by more and more wind farms, you still have to pay for the gas and coal plants to stand by as backup dependable capacity that you know you’re going to need during the most challenging weather and temperature conditions.
Put another way, no matter how “cheap” wind farms become on an individual basis (which is all the “green energy” zealots talk about), the cost to utilities and their rate payers for building both a clean and reliable grid based on increasing penetrations of intermittent and variable wind, will always require some level of ‘double paying’ in terms of up-front capital investment.
As we think about how we want to move forward with clean energy development, it is critically important to look at the power grid through the lens of basic utility requirements which can be viewed as a three-legged stool; with affordability, reliability, and environmentally-responsible representing the legs.
The simple fact is you cannot have 100% of any one of these three legs without significantly impacting the other two. Additionally, all sources of energy involve tradeoffs; no exceptions.
In the case of SWPP, they have done a great job of integrating a tremendous amount of nameplate wind capacity and have so far been able to keep the stool standing quite nicely as far as I know. But they are only at 37% of annual energy in their footprint coming from wind, which I would argue is the easy part of the “energy transition”.
Having reviewed SWPP’s generation “resource adequacy” assessment for 2022, I was able to confirm they have reached an “effective capacity” saturation point of around 15% for wind. What this means is for every 1,000 MW of new wind capacity they integrate into their footprint going forward, only about 150 MW should be expected to show up at the most critical times of high electricity demand.
And this is just what happened during the polar-vortex when only 4,708 MW of the 31,217 MW of installed wind capacity in the SWPP footprint was contributing to the supply stack during some of the hours of peak demand for electricity (4,708 MW divided by 31,217 MW = 15%).
FINAL THOUGHTS
The fact that electricity provided by the power grid is simultaneously generated, transmitted and consumed is an unforgiving law of physics, and is why no matter what politicians promise, the retail cost of electricity will always go up as the power grid integrates higher and higher levels of wind and solar; assuming you want to maintain reliability.
Just look at the residential cost of electricity in Europe shown in the following graph where Germany has integrated more wind and solar capacity on a per capita basis than any other country. Using the euro-to-dollars conversion from 2019, German residential customers are now paying more than 35 cents per kilowatt-hour compared to the utility I work for with an all-in cost of just under 9 cents, and a U.S. average of around 13 cents.
In the US, California which is further down the path of implementing European style clean energy policies than most states, is heading in the same direction as Germany when it comes to high residential rates. And all indications are Washington and Oregon think what California is doing should be their model as well.
As shown in the charts below, three investor-owned utilities (IOUs) in California are projecting they will soon have residential rates exceeding 30 cents per kWh, and in the case of San Diego Gas & Electric (SDG&E), they are projecting rates over 40 cents per kWh.
In addition, after many years of declining cost curves for wind and solar farms, we are now experiencing worldwide raw-material constraints which are being compounded by overall supply-chain inflation. The result has been significant increases in the cost of new wind and solar farms. And I do not see any reason to believe this trend will change as western nations continue to clamor for more and more wind and solar, while doing almost none of the mineral extraction and refining in their own countries.
So, I see no evidence based on a review of actual experiences or current utility planning that indicates a wind and solar based clean energy strategy will deliver on affordable rates and reliable electricity in an attempt to meet 100% clean electricity mandates.
And the idea, wind and solar are uniquely kind to the environment ignores the massive and disproportionate impact these technologies have when you consider how much energy they deliver per pound of materials used and square miles of land they cover.
While it is heretical for me to say it, there really is no such thing as “renewable energy”. Sure, there are renewable fuels, but from the earth wind turbines and solar panels will come, and back to the earth they will go.
Of course it may be possible for efficient and cost-effective recycling to be figured out and scaled to the level that will be needed. But given the rapidly growing volume of waste and the energy and cost that will be required, I am skeptical. Overall, we really need to have a much more serious conversation about wind and solar as “sustainable” technologies, particularly when you consider they are being proposed as “the technology” but only provide a fraction of US and global energy today.
As you try and digest the scale of what is being proposed in terms of the “clean energy transition” it is important to know that even though wind is now producing over 10% of electricity in the US; electricity only represents about 37% of total energy consumption.
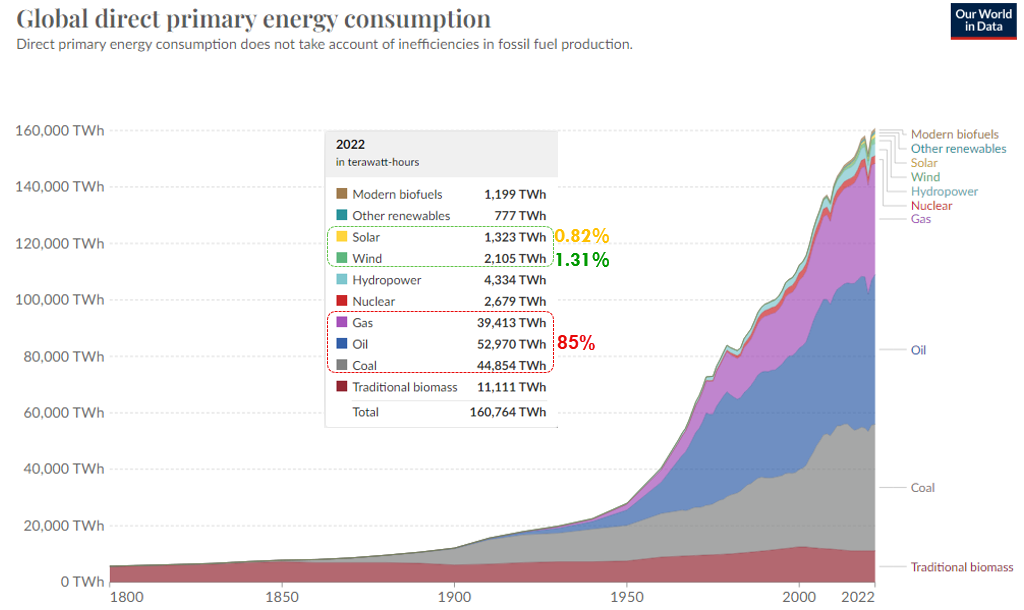
To grasp what it would mean to rapidly eliminate fossil fuels in the US, you have to look at the following chart and consider the scale of what is being proposed based on total energy consumed. Today, the US still relies on coal, natural gas and petroleum for 79% of our total energy. And we only derive 5.6% from wind and solar combined. So just on its face, a plan to rapidly transition off of fossil fuels is just not credible.

And since transitioning to cleaner energy is a global issue, it cannot be said enough, after several trillions of dollars of subsidies and investments in wind and solar throughout the world, these technologies only represent 2.1% of total global primary energy consumption.
You may be a fan of the “all of the above” strategy and I get that. But I am more in the camp of “always the best” technology; and making sure we are doing honest and comprehensive lifecycle evaluations of all electricity generation and energy technologies. And that the utility three-legged stool stays balanced.
But despite the numbers and common sense, wind and solar are where the big dollars are being spent in terms of new electricity generating capacity in the US. And of course this is the case when the federal government continues to print money and pour it into wind and solar with what can be best described as a ‘religious level’ commitment.
And if you think this is a ‘red state versus blue state’ issue, don’t forget the 47% of US wind capacity built in middle America and Texas. Clearly, ‘green energy’ crony capitalism knows no political boundaries.
One of the additional perverse outcomes of federal production tax credit (PTC) subsidies for wind farms is how they undermine the economic viability of dependable generating technologies like coal and natural gas; which is leading to the premature shutdown of far too many plants before the end of their useful lives.
This is a big factor in why we are hearing from the North American Reliability Corporation (NERC) about their growing concerns over increasing blackout risks across the United States. In their Long-Term Reliability Assessment released in December 2023, NERC stated: “Capacity deficits are projected in areas where future generator retirements are expected before enough replacement resources are in service to meet rising demand forecasts.”
NERC’s concerns include the Western US where reliable grid operations is managed by the Western Electricity Coordinating Council (WECC). In WECC’s Western Assessment of Resource Adequacy report released in November 2023, they indicated the risk of capacity shortfalls is low through 2025, but "starting in 2026, the number and magnitude of demand-at-risk hours increase by orders of magnitude" and that “resource adequacy risks over the medium and long term have increased significantly compared to last year's assessment.”
I am convinced at this point the U.S. must move forward with development of conventional nuclear on the 1,000 MW scale which isn’t happening as far as I know. Additionally, small modular nuclear (SMR) with melt-down-proof and walk-away-safe advanced technology offers the promise of even more energy density and the possibility of locating generating plants closer to where people live in urban areas with the highest demand for electricity.
And new SMR nuclear could be the answer to reducing the need for expensive interstate high-voltage transmission lines often opposed by land owners and other interests; and which require long permitting and construction times which can easily exceed 15 years or more based on recent project experiences.
In summary, the ‘clean’ electricity strategy I continue to endorse for the northwest is to first and foremost keep hydro in place. And then work on a more rational transition from coal to natural gas, and then to nuclear as the foundation. And if there are places wind and solar can be built where people want it, or are at least neutral, then I am willing to compromise. But the idea wind and solar are the foundational building blocks of an affordable, reliable, and environmentally responsible and properly balanced clean energy transition, that I cannot sign up for.
I know I am pushing back against what feels like an inevitability, but I deeply believe we need to come to terms with the reality we are living in and change the course we are on soon. We can do so much better than continuing to develop more and more backward looking technology like expansive and ecologically disruptive wind farms. And our kids and grandkids deserve better.


1/22/24
Just found a wind turbine article where the Judge ruled against the wind turbines & the company is going to have to remove 84 turbines over 8,400 acres on tribal Oklahoma land. See link below:
https://climate-science.press/2024/01/22/judge-orders-wind-farm-dismantled-in-win-for-tribal-sovereignty/
Very solid review of how we need to think of wind as solar as part of a much larger system. System thinking seems to be missing in a lot of the transition plans.
Thank you.