

Energy Transition: Visions, Delusions & Nightmares
What the data says about a wind and solar fueled "Energy Transition"
In 2024 I had nearly two dozen public speaking engagements with a broad range of audiences including civic, economic-development and industry-trade groups, as well as electric utility colleagues and customers. While I can’t be sure, there is a distinct possibility I may have set a record for PowerPoint slides per minute. Try as I might, I just could not get myself to lighten up on the slide count.
There is just so much that needs to be said about the absurdity of an "energy transition" reliant on energy-dilute, unreliable, land-intensive, and costly wind and solar power. Yes, I am clearly an outlier at best and a "denier" at worst. But I digress.
Having worked in the electric utility and power industry for more than 38 years gives me a leg up when it comes to understanding the fundamentals of energy policies. However, like everyone else, I rely on information from other sources to gain a broader perspective.
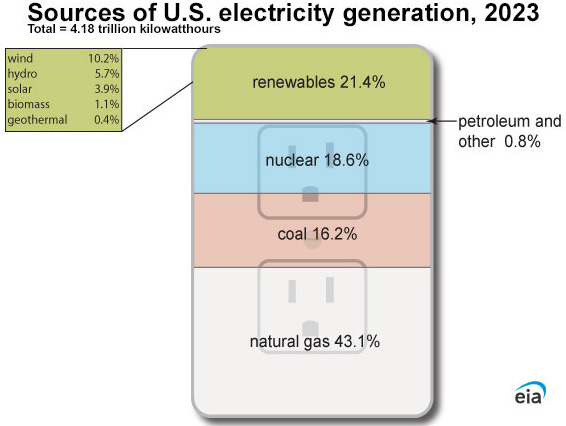
One source I have come to trust is the U.S. Energy Information Administration (EIA). Of the dozens of charts and graphs included in my rapid-fire presentation slide decks, the following EIA pie chart is a real stunner given the non-stop news reports of the “climate crisis” and claims that a dogmatic devotion to wind and solar technologies is our only hope.
Contrary to the popular narrative, beloved wind and solar only represented 2.6% of total U.S. primary energy consumption in 2023, and ‘evil’ fossil fuels (hydrocarbons) represented 83%.

To help digest the stunningly low numbers for wind and solar it is important to keep in mind that energy represents the capacity to do work and that direct use of combustible fuels in residential, commercial, industrial and transportation sectors is where the vast majority of work on the planet is being done today.
Electricity generation which represents an indirect use of fossil-fuels accounts for only 34% of U.S. and 19% of global primary energy consumption.
Understanding this point is critical, as conflating electricity generation with energy production in general is a common misunderstanding frequently perpetuated by politicians, academics and journalists when reciting the mantra of the wind and solar energy-transition.
With this said, it is important to point out that energy losses in the fuel combustion process leading to the production of electricity from natural gas and coal are significant and in the range of 40% to 60% . So understanding the impact of wind and solar electricity generation on primary energy consumption can be confusing.
While not their preferred approach, EIA addresses the apples-to-oranges issue by providing a conceptual measure using what is called the Fossil Fuel Equivalency Approach which credits the energy produced by wind and solar power as if it perfectly displaces fossil fuels. In this generous assessment, wind and solar represented 5.8% of U.S. primary energy consumption in 2023.
Whether the number is 2.6% or 5.8%, wind and solar are clearly struggling to move the needle in the often-hyped rapid energy transition supposedly underway in the United States. But what about the rest of the globe?
According to Our World in Data, the global energy transition isn’t showing much progress either, with wind and solar representing 2.4% and fossil-fuels at 85% of global direct primary energy consumption in 2023. And when you add firewood and charcoal to the mix, 92% of global energy consumption involves carbon-dioxide (CO2) emitting sources.

A key point being, a real energy transition is a massively bigger lift than ‘simply’ converting electricity generation to so-called emissions free technologies. This is only baby-step one. And don’t forget the nearly 3 billion souls on the planet who use almost no energy, including 1.18 billion who have no access to electricity. Should they just be left at home and sitting in the dark?
It seems reasonable to assert energy poverty is human poverty and that the world needs more access to abundant, affordable and reliable energy, not less. And Western Civilization is not going to convince poor people in other countries to stay poor, nor should we.
Like other developing nations, China and India are digging their citizens out of poverty, and their primary tool continues to be ever expanding use of coal and natural gas. This trend is reflected in the previous chart and confirms the physical, engineering, and economic realities of energy systems. There is simply no denying, reality does not support a wind- and solar-fueled energy transition.
Energy-dense fuels and the ability to reliably produce a whole lot of affordable electricity on a small footprint matters more than ever before. And if we are going to insist on dramatically lowering CO2 emissions, then we are going to need more time and the only energy transition that makes sense is natural-gas-to-nuclear (N2N).
Like Alex Epstein, I am bullish on nuclear energy over the long term, but the U.S. largely abandoned nuclear decades ago, and it will take a monumental effort to recover lost ground.
“There is currently only one energy technology that can match (actually exceed) fossil fuels’ combination of naturally stored, concentrated, abundant energy: nuclear. Nuclear may one day outcompete all uses of fossil fuels, but this will take radical policy reform and generations of innovation and work.”
Alex Epstein, Energy Talking Points, “The 7 most important truths about our energy future”
How is the U.S. doing with Baby-Step One of the Energy Transition?
According to EIA data, wind and solar supplied 14% of U.S. electricity in 2023. If our energy transition is urgent, then the next obvious question is how long it took to get to this point.
A good place to start is 2009 when the American Recovery and Reinvestment Act (ARRA) was enacted. This federal legislation cranked up production and investment tax credits (PTC & ITC) for wind and solar which began driving huge annual investments in these technologies, reaching an estimated $93 billion for calendar year 2023.
EIA data also reveals wind and solar broke through the 1% of U.S. electricity supply threshold in 2008 and then increased to 1.9% in 2009. So it took fourteen years for wind and solar to gain an additional 12% share of the U.S. electricity supply stack.
But what about the supply stack, is it growing as well? After all, if wind and solar are driving an energy transition through large-scale electrification of all sectors of the economy, surely the amount of electricity generated in the U.S. must be increasing substantially.
Not so according to the following graphic from the U.S. Environmental Protection Agency (EPA) which shows electric power generation has been relatively flat since 2007, even declining in some years. EIA data also confirms demand for electricity has been flat for most of the last 15 years with 2023 registering a 2.8% increase in demand over the level recorded in 2007.
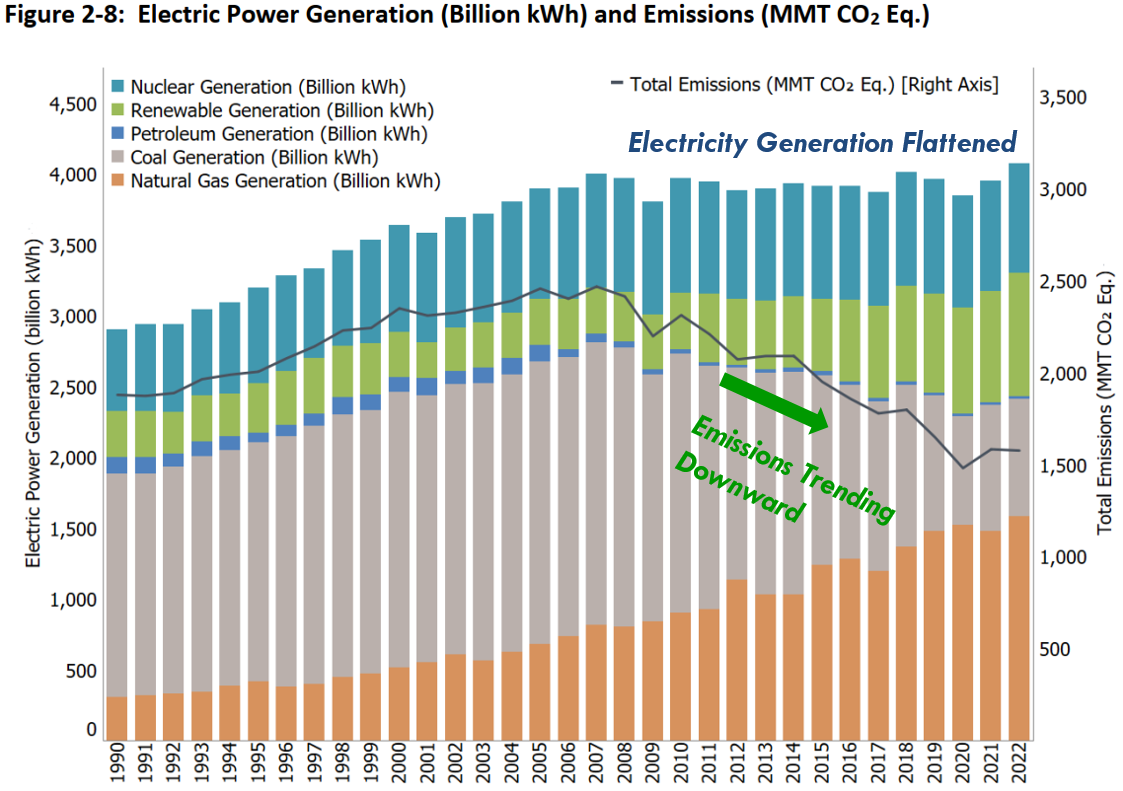
Another important insight on the previous graphic is provided by the dark-line (and right-side y-axis) which shows a 36% reduction in electric power generation CO2 emissions since 2007.
What is surprising to many people I’ve talked to is about 65% of the decline in emissions is attributable to “fuel switching” from coal to natural gas plants and about 30% of the decline is attributable to increased wind and solar generation.
So, after fourteen years and hundreds of billions of dollars invested in wind and solar power, the U.S. has increased the share of electricity supplied by these technologies by 12%, with relatively modest contributions toward CO2 emission reductions, and little evidence of electrification.
This raises a question. What does growing the share of wind and solar generated electricity by less than an average of 1% per year so far tell us about the odds the U.S. is going to meet the 100% carbon-free electricity by 2035 goal set by outgoing President Joe Biden?
And when you add the emerging and significant incremental demand for electricity required for data centers (and artificial intelligence) which the U.S. Department of Energy expects could triple by 2028 from 4% of total electricity to 12%, carbon-free electricity visions based on wind and solar power are becoming more detached from reality than ever before.
Worse, in light of the recent announcement by the North American Electric Reliability Corporation (NERC) that about half of the United States is at increased risk of power supply shortfalls in the next decade, one could argue U.S. energy policies are now becoming dangerously delusional.

The bottom line is that overly subsidized, intermittent wind and solar are artificially undermining power grid reliability by rendering dependable (controllable) technologies economically unviable. But politicians on both sides of the aisle are loathe to put an end to the high-stakes grift.
Think about it. The so-called energy transition has barely begun, yet it is already pushing the power grid in some regions of the U.S. to the edge of a blackout cliff.
Yes, I know—batteries and breakthroughs in long-term energy storage are expected to provide the solution. But I’m not convinced. I remain skeptical that an affordable, reliable, and ecologically responsible energy transition is possible with inherently deficient wind and solar, regardless of advancements in energy storage technology.
In addition to their weather-dependent and part-time operating characteristics, wind and solar technologies are also energy-dilute. This means they are material intensive and require vast land areas in their inefficient attempt to replace hydrocarbon-based technologies.
In my view, regardless of technology, energy storage props up critically flawed wind and solar farms at a high financial cost while further driving the excessive expansion of land-intensive infrastructure. And where there is overbuilding, the resulting ecological costs cannot be ignored.
Are we Wrecking the Planet to Save It?
Take a look at the following map of U.S. wind farms and consider where our current clean energy policies have led us—and where they are taking us in terms of their ecological impact on various regions of the country.
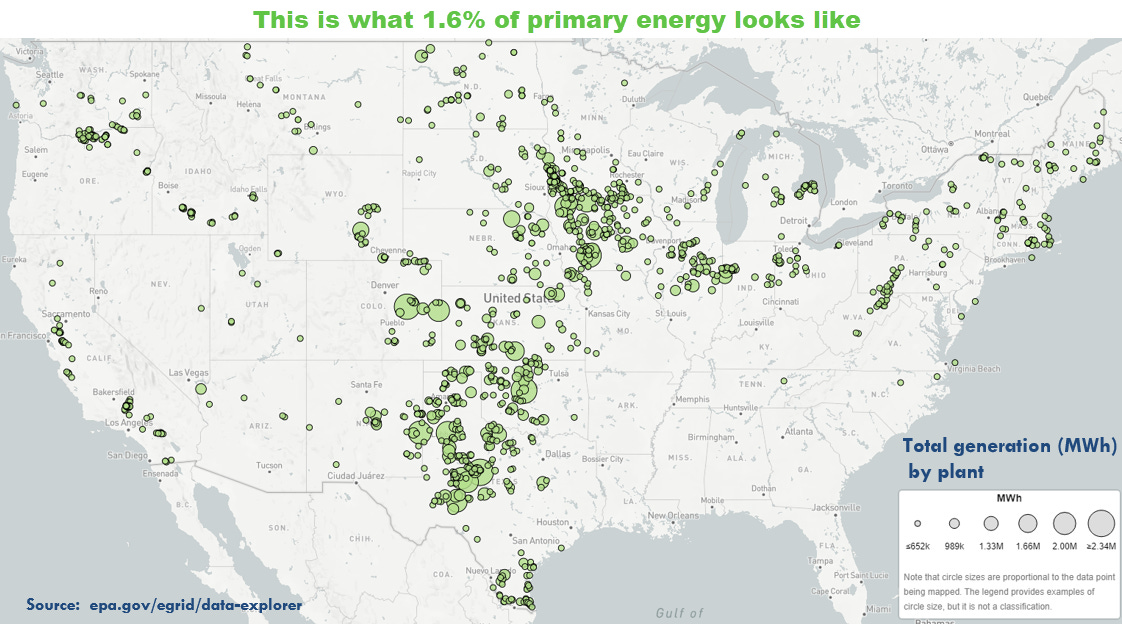
What the circles on the map represent are nearly 75,000 individual industrial wind turbines, which as I stated earlier accounted for only 1.6% of U.S. total primary energy consumption in 2023.
And when you consider utility-scale wind farms typically become economically viable at average annual wind speeds of 6.5 to 8.0 meters per second (m/s) or higher, you have to question whether people (and animals) living in and near the areas represented by the brown to purple coloration on the following map will have an unending appetite for more-and-more industrial wind farms.

Robert Bryce has been writing for years about the growing Not-In-Our-Backyard movement which since 2015 has spawned 735 rejections or restrictions of wind and solar energy in the US.

What Robert had to say in 2021 was true then, but even more so today.
“Land-use conflicts are a key issue today and those conflicts are already proving to be the limiting factor in the growth of renewables”.
Robert Bryce, Center of the American Experiment, Not In Our Backyard, April 24, 2021
You don’t have to look far to find articles like the one below, which highlights Robert’s point and the clash between the fanatical pursuit of CO2 reduction at any cost and long-standing conservation policies aimed at preventing or limiting the industrialization of rural and natural landscapes.

Is Solar the Lesser of Two Evils?
While it is clear in my research that wind farms are facing increasing development friction, it is also clear solar power is emerging as the perceived lesser of two evils.
As reported by the American Public Power Association (APPA) in April 2024, 51% of all new generating capacity under development at that time was for solar, followed by wind (33%) and natural gas (7%). APPA also reported “three-quarters of the wind capacity is in the “proposed” stage, which is the earliest and most uncertain stage of development and includes units that are least likely to be built.”
The following map illustrates the states and regions most committed to solar power, which according to EIA data reached a combined 91.3 gigawatts (GW) of nameplate generating capacity in the U.S. at the end of 2023.

For perspective, solar power increased to 7.6% of the 1,190 GW of nameplate generating capacity represented by all technologies in the US. But remember, daytime-only solar panels produced just 3.9% of total U.S. electricity and represented only 1% of primary energy consumption.
In spite of solar power’s nighttime problem, thanks to state carbon-free energy mandates and federal tax-payer subsidies included in the so-called Inflation Reduction Act (IRA), 2024 was a banner year for new project development.
As of August, U.S. utility-scale solar power had grown to 107.4 GW of nameplate capacity with another 24 GW expected to come on line by the end of December.
Additionally, the EIA estimates small-scale solar capacity in the U.S. reached 47 GW in 2023 which is not accounted for in total electricity generation data. These “behind-the-meter” non-utility installations include familiar rooftop technology representing a total estimated energy contribution equivalent to 1.7% of U.S. total electricity generated in 2023.
Clearly small-scale solar, along with increased utility conservation measures and improved efficiencies have contributed to the flattening of utility electricity demand I mentioned earlier.
While solar farms may seem less intrusive than the unsettling sight of hundreds of 600-foot industrial wind turbines stretching to the horizon, the widely embraced solar panel—often seen as the poster child of "green" and "sustainable" energy—loses some of its luster when considering the ecological challenges emerging as deployment scales up.
ChatGPT acquired data indicates it would be reasonable to assume 385 watts per panel for utility-scale solar farms and 325 watts per panel for small-scale solar, which based on end-of-year installed-capacity projections for 2024 means there are more than 485 million individual solar panels installed in the United States today.
I asked ChatGPT to run the numbers for itself, and it indicated my math may be on the low end, and that the number could be over 600 million panels. Maybe that doesn’t get your attention.
But consider this. If utility-scale solar farm development in the U.S. continues to grow at the rate experienced in 2024, we will exceed 1 billion installed solar panels over the next 3 to 5 years.
So, it’s important to keep the following in mind as you consider the legacy we could be leaving for the next generation:
It required hundreds of millions of individual panels to get to the point where solar provides 1% of primary energy consumed in the United States, and it will require many billions more just to get to double digit percentages.
The U.S. does not have a federal recycling mandate for solar panels.
While it is technically feasible to recycle solar panels, recycling costs $30–$40 per panel, while landfilling costs $1–$20 per panel.
Closing Thoughts
Currently wind and solar represent 84% of new electricity generation being developed in the U.S. today. Under the Inflation Reduction Act, Treasury Department numbers reveal wind and solar tax subsidies dwarf all other energy-related provisions in the federal tax code. And as documented by Robert Bryce will cost taxpayers $421 billion by 2034.
Bryce had this to say about wind and solar subsidies:
“[O]ver the coming decade, thanks to the ITC+PTC, the alt-energy sector will get nearly 18 times more in federal tax credits than the entire hydrocarbon sector — which now provides about 81% of all US primary energy — and nine times more than the nuclear sector.”
Wind and solar technologies are not only expensive, energy-dilute and unreliable, they are also far more mineral intensive than hydrocarbon based machines, requiring an estimated increase in mining of between 900% and 1,800% per watt of electricity generated.

After much research and consideration, it seems to me what Mark Mills had to say in an eye opening report published in 2022 makes a lot of sense and should be required reading for elected officials and utility leaders.
“Despite ever-escalating rhetoric, an “energy transition” away from society’s dependence on hydrocarbons is not feasible in any meaningful time frame, and it is a dangerous delusion to base policies on the idea that such a transition is possible.”
Mark P. Mills, Senior Fellow Manhattan Institute: “The “Energy Transition” Delusion: A Reality Reset”, August 2022
Bipartisan support for new nuclear power is encouraging, but it will be at least a decade before nuclear gains a meaningful foothold and recovers from severely depleted—or even non-existent—supply chains and technical resources.
In the meantime, we must make room for more natural gas power plants and a more rational energy transition. Doubling down on fatally flawed wind and solar technologies as the backbone of energy policy is clearly delusional—not just for the United States, but on a global scale.
Dogma has replaced physics, engineering, and economics in shaping energy policies. Citizens must demand far more from their elected officials and utility leaders.
If we don’t act, I fear the current clean energy vision could turn into a nightmare for future generations. On top of being expensive and unreliable, wind and solar could turn out to be far more ecologically destructive than supporters are willing to acknowledge. We can and must do better.

Until leftists understand that CO2 is not a GHG and that more of it is actually better for the earth and it’s inhabitants, facts about the impracticality of “renewable” is not persuasive - after all it’s their religion and their path to the destruction of capitalism and installation of worldwide communism
Excellent article, again. Thank you.
Just talked to a colleague in Arlington, TX. Cold wave there, and right on schedule, wind power production has dropped way down for the last few days. So far, nat gas and coal are picking up the slack. :) Jim Cantore just arrived in the N Central TX area, so they're expecting the worst.